

Contacts
Contact Analytics
View charts and statistics about your contacts to understand customer patterns.
What Is Contact Analytics?
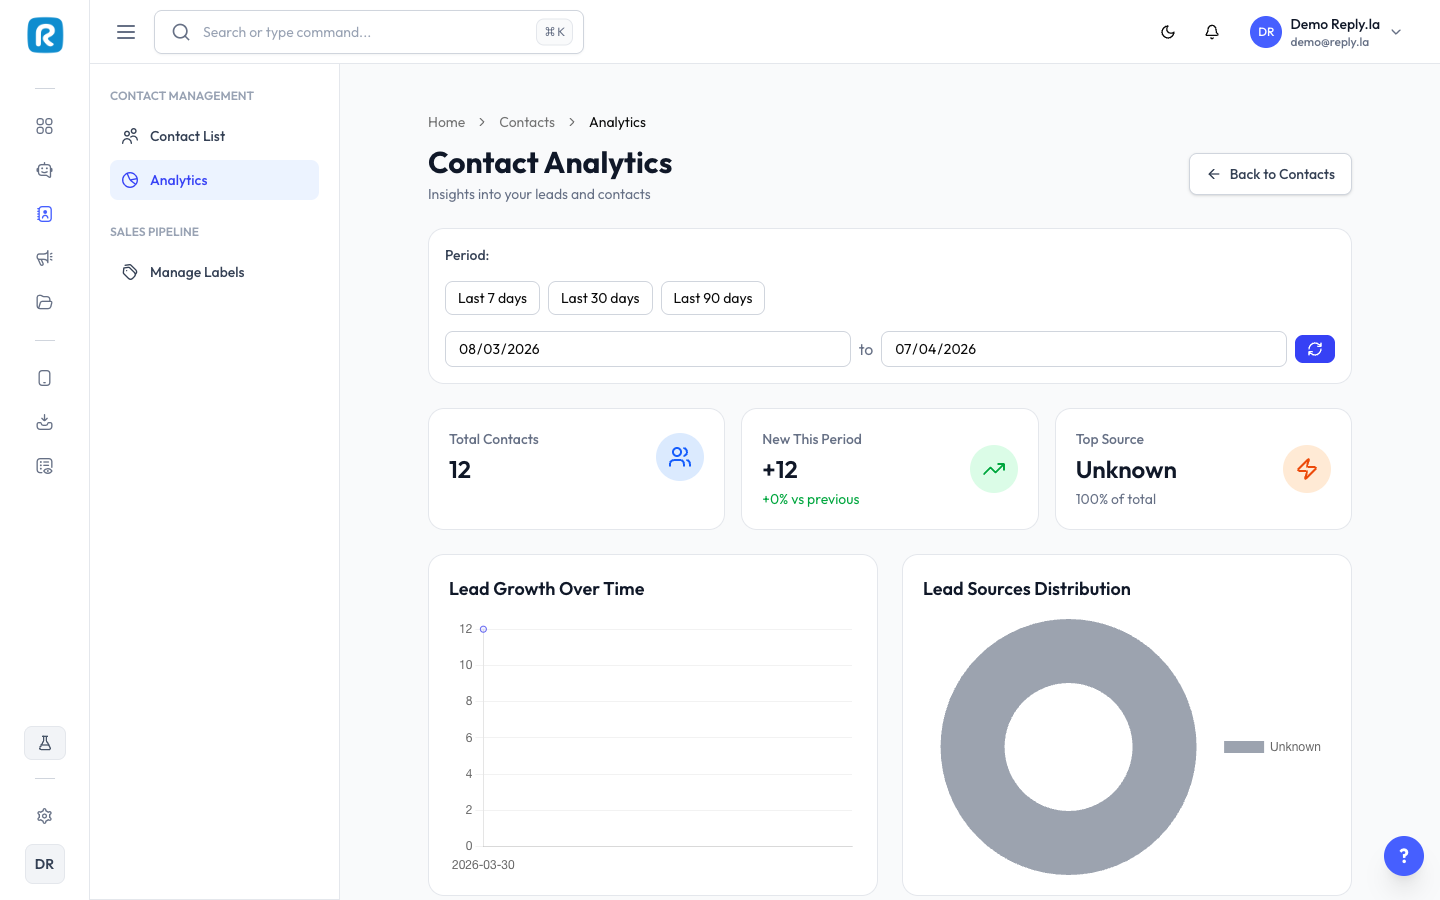
Contact Analytics gives you a visual overview of your customer base. You can see how many new contacts you're getting, where they come from, how they break down by label, and which campaigns bring them in.
How To View Analytics
- Click Contacts > Analytics. You can also click the Analytics button on the Contact List.
- Under Period, choose Last 7 days, Last 30 days, Last 90 days, or set your own dates.
What You'll See
- Total Contacts, New This Period, and Top Source - Your headline numbers.
- Lead Growth Over Time - Chart showing new contacts over time.
- Lead Sources Distribution - Where contacts are coming from.
- Labels Distribution - Breakdown of contacts per label.
- Lead Source Performance - A table of each Source, its Leads, and its % of Total.
- Top Campaigns - A table of each Campaign, its Type, Platform, and Leads.
Check analytics weekly to spot trends. If new contacts are dropping, it might be time for marketing. Use Labels Distribution to see your sales pipeline, for example how many "Hot Lead" contacts you have compared to "Customer".
Common Questions
Analytics show data from when you started using Reply.la. You can filter by date range.
You can export your contact list from the Contact List page. Analytics charts are visual summaries.
Last updated: 5 November 2026